On our blog, The 1O1, we’ve walked you through the process of a successful digital marketing strategy, including website design, SEO, PPC, email marketing, and content marketing. But what good does a marketing campaign do if you can’t analyze the results to determine what generated the best results? Analytics are essential to any digital marketing program and can help fine-tune the campaign for optimal results. Analytics should be built into every aspect of your marketing strategy and reviewed constantly. At Rize AVS, we specialize in digital marketing and analytics to help develop your brand. Rize AVS is a division of Rize Marketing Company, a multi-discipline marketing agency with decades of industry experience and expertise, allowing us to develop marketing strategies that provide the best results. Let’s take a closer look at what some of those results include!
What Can I Track with Analytics?
Digital analytic data not only tells you if your marketing is working but also precisely how and where you can improve. Analyzing digital marketing data allows you to recognize patterns or trends to help you make strategic decisions, resulting in improved marketing, resource allocation, and campaign planning. You get insight into campaign performance, growth areas, and customer interests through analytics.
Campaign Performance
Once your marketing campaign has begun, digital marketing analytics help you measure its efficiency. In granular detail, you can see if your campaigns are successful, even drilling into what makes them successful. You can adjust or even end the campaign and move your budget elsewhere if it is not performing as desired.
Growth Areas
Marketing analytics can help you identify emerging opportunities for growth. For example, tracking popular keywords, trends, topics, or products can help you shape the development of your products and campaigns.

Customer Interests
Tracking customer behavior in real-time can quickly identify content that resonates with your customers best. Based on the analytics you get, you can better target your ideal customer based on age, location, interests, marital status, hobbies, devices, or more.
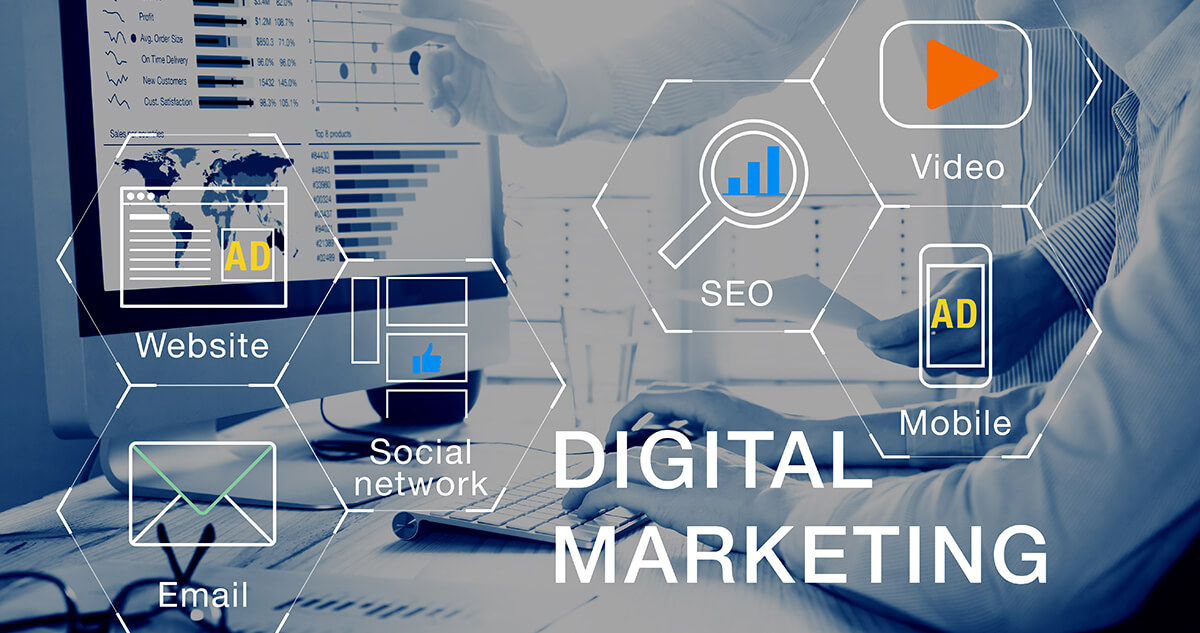
Where Can I Use Analytics?
There are many ways to evaluate your marketing analytics, the most effective of which depends on your company’s goals and key performance indicators (KPIs). Because your website is a 24/7 salesperson, it’s generally the best place to start with analytics. However, all areas of marketing can be tracked and analyzed.
Websites
Website analytics typically include the following: website visits, time spent on the site, pages viewed, returning visitors, bounce rate, average page views, new visits, and referral sources. These metrics will help you understand how many new and returning visitors you have and how long they spend on your web pages. The bounce rate is the percentage of visitors who leave your website after viewing a single page. Referral sources track outside sources that have directed traffic to your site, such as email, search engines, and other external links.

Social Media
When evaluating social media campaigns, marketers often track the number of followers, engagements, reach, impressions, click-through rate, conversion rate, and cost per action. These analytics together give you insight into the total number of times a post or ad loads on a page, how many people see it, and how many times it is successful and leads to conversions. Though similar, reach and impression are two very different metrics. Reach is the number of unique users who have seen your post or ad, while impressions are the total number of times a post or ad loads on a page. A single user may account for multiple impressions, but users are only counted once for reach.
Email Marketing
Most email marketing providers will give you insight into the open rate, click-through rate, unsubscribe rate, email bounce rate, and conversion rate. The click-through rate is the percentage of people who click on a link or button in the email, and the bounce rate is the percentage of emails that didn’t reach their intended recipient due to a technical issue, such as firewalls or incorrect addresses. Like social media analytics, the conversion rate is the percentage of users who completed the desired action after receiving your email, such as clicking a link or completing a survey.
Lead Generation
Lead generation analytics often show you the number of leads, lead conversion rate, cost per lead, lead quality score, and return on investment (ROI). The number of leads is how many people have interacted with your company or brand in the past, and the lead conversion rate is the percentage of leads converted into customers. The cost per lead is the amount of money spent to generate a single lead, and the ROI is a measure of profitability measured by dividing the revenue generated by the total campaign cost. The lead quality score measures the quality of the leads generated based on various metrics like demographics. The lead quality metric measures how likely a lead is to convert into a customer.
Watch Your Analytics Rize
Tracking your marketing campaign is a hefty task and the results are not always clear. Let us help! Our team at Rize AVS will not only assist you in developing your marketing strategy, but we will implement it and help you analyze it. Using all aspects of digital marketing and analytics will result in a successful online presence for your company. Contact us today to get started!